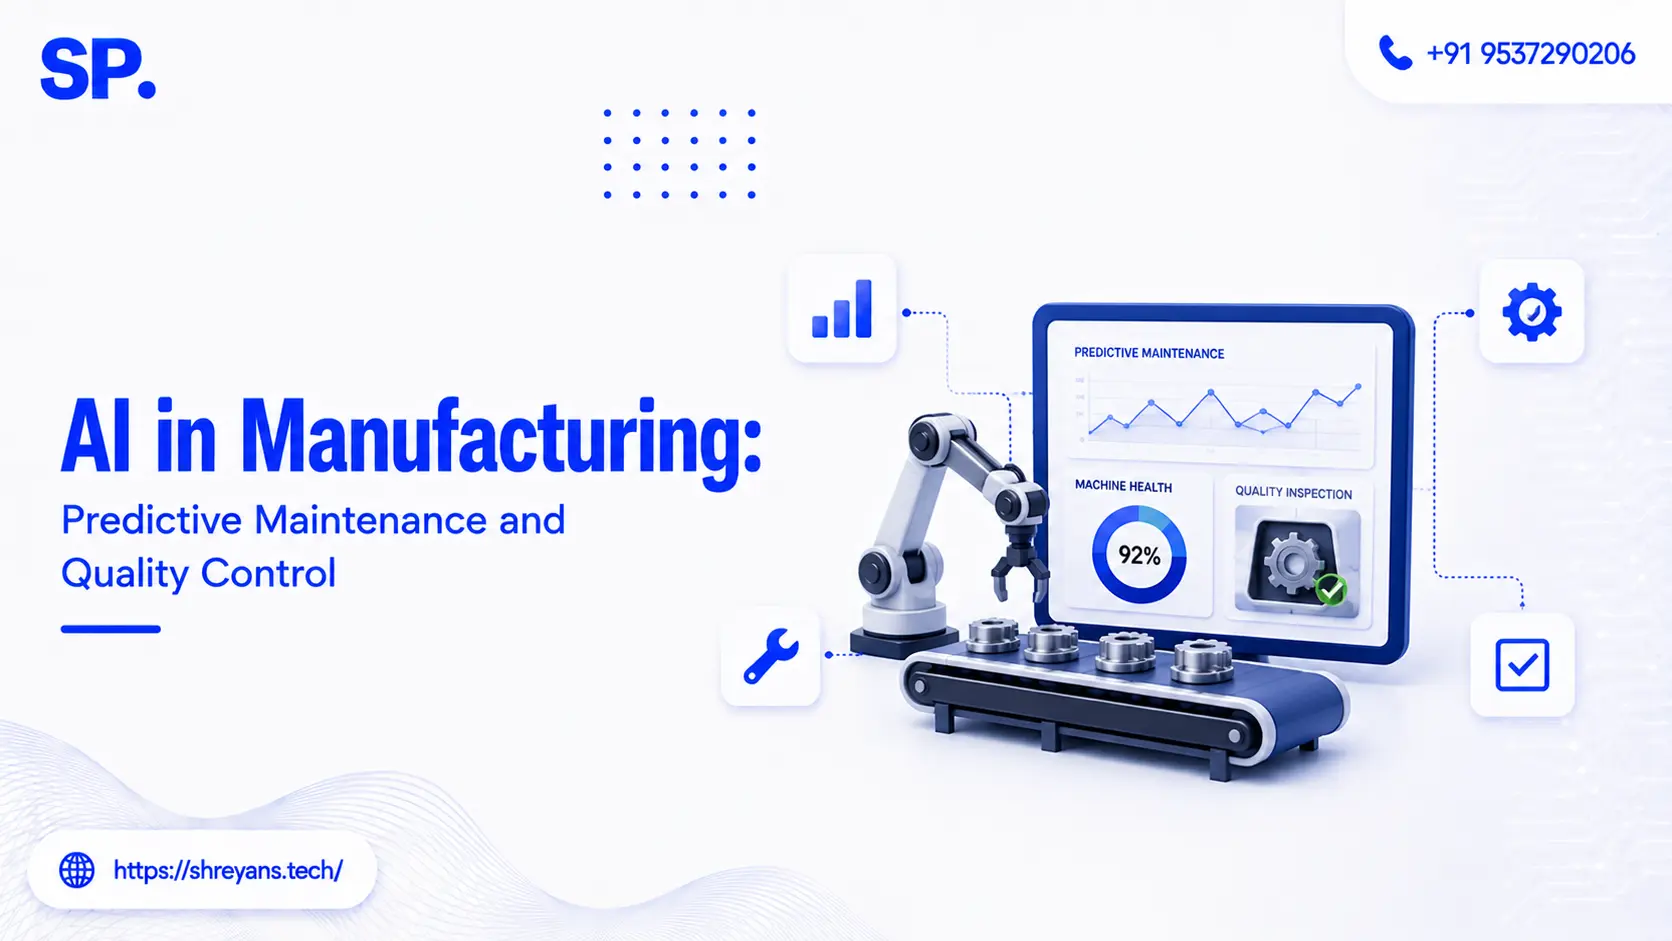
AI in Manufacturing: Predictive Maintenance and Quality Control

The average manufacturing facility now loses roughly $260,000 per hour of unplanned downtime, a figure about 50% higher than it was in 2019. Against that, documented predictive maintenance programmes consistently return 10:1 to 30:1 within 12 to 18 months, with 95% of implementers reporting positive returns.
So why does 25% of plants cite budget justification as their top barrier? Because the ROI is clear at industry level and genuinely hard to model for your plant without historical failure cost data. And because ai in manufacturing is usually budgeted as one initiative when it's actually two very different ones. Here's the distinction, and what each side really requires.
Two Problems That Look Like One
Predictive maintenance and quality control both get filed under manufacturing AI, and they share almost nothing technically. Treating them as a single programme is one of the most common reasons a plant succeeds at one and stalls on the other.
|
Predictive maintenance |
Quality control |
|
|---|---|---|
|
Data type |
Time-series sensor streams (vibration, temperature, acoustic, current) |
Images and video of parts or surfaces |
|
Hardware needed |
Sensors on assets, $200–$2,000 each, plus IoT infrastructure |
Cameras, lighting, and mounting on the line |
|
Model family |
Anomaly detection and time-series forecasting |
Computer vision, classification and segmentation |
|
Hardest input to get |
Historical failure examples |
Labelled defect images, especially rare defects |
|
What failure costs you |
A missed prediction means unplanned downtime |
A missed defect reaches the customer |
Different sensors, different models, different skills, different failure economics. They can share a data platform and a governance model, but they should be scoped, budgeted, and staffed as separate workstreams.
Predictive Maintenance: What It Actually Delivers
This is the more mature and better-documented of the two, and the results are consistent across sectors rather than concentrated in a few flagship cases.
|
Outcome |
Documented range |
|---|---|
|
Unplanned downtime reduction |
30–50% (up to 50–65% with an optimised hybrid strategy) |
|
Maintenance cost reduction |
18–25% versus calendar-based preventive programmes |
|
Equipment lifespan extension |
20–40% |
|
OEE improvement |
+15 to +25 points, commonly from 55–65% to 72–85% |
|
Advance warning before failure |
Typically 2–6 weeks on well-instrumented assets |
|
Parts inventory reduction |
40–50%, as emergency stocking becomes unnecessary |
The advance-warning number is the one that drives everything else. Weeks of notice converts an emergency into a scheduled intervention: parts pre-staged, work planned into a window, no overtime, no scrap from a hard restart. That's why mean time to repair typically falls alongside downtime frequency rather than only the number of incidents dropping.
Worth noting: predictive monitoring isn't the right answer for every asset. Around 66% of manufacturers run a hybrid strategy, reserving predictive programmes for critical, high-value equipment where failure is expensive, and keeping calendar-based preventive maintenance on non-critical assets with predictable wear patterns. Instrumenting everything is a common and expensive scoping error.
Hire Edge Computer Vision
The Data Paradox Nobody Mentions Upfront
To predict failures, a model generally needs examples of failures. But a well-run plant has spent years deliberately preventing exactly those events, which means the better your maintenance programme has historically been, the less failure data you have to train on.
This is the practical reason predictive maintenance projects often take longer to reach useful accuracy than the vendor timeline suggests. Typical deployment sequences allow two weeks for asset and data audit, three to four weeks for model training against historical failure data, and several more for pilot validation, and that middle phase stretches when the historical record is thin.
There are real workarounds, anomaly detection that learns normal operating behaviour without needing labelled failures, transfer learning from similar asset classes, and physics-informed models that encode known degradation patterns. But the question to ask any vendor is direct: how many documented failure events do we have per asset class, and what's your approach if the answer is close to zero? A vendor without a specific answer is assuming data you may not have.
Quality Control: The Vision Side
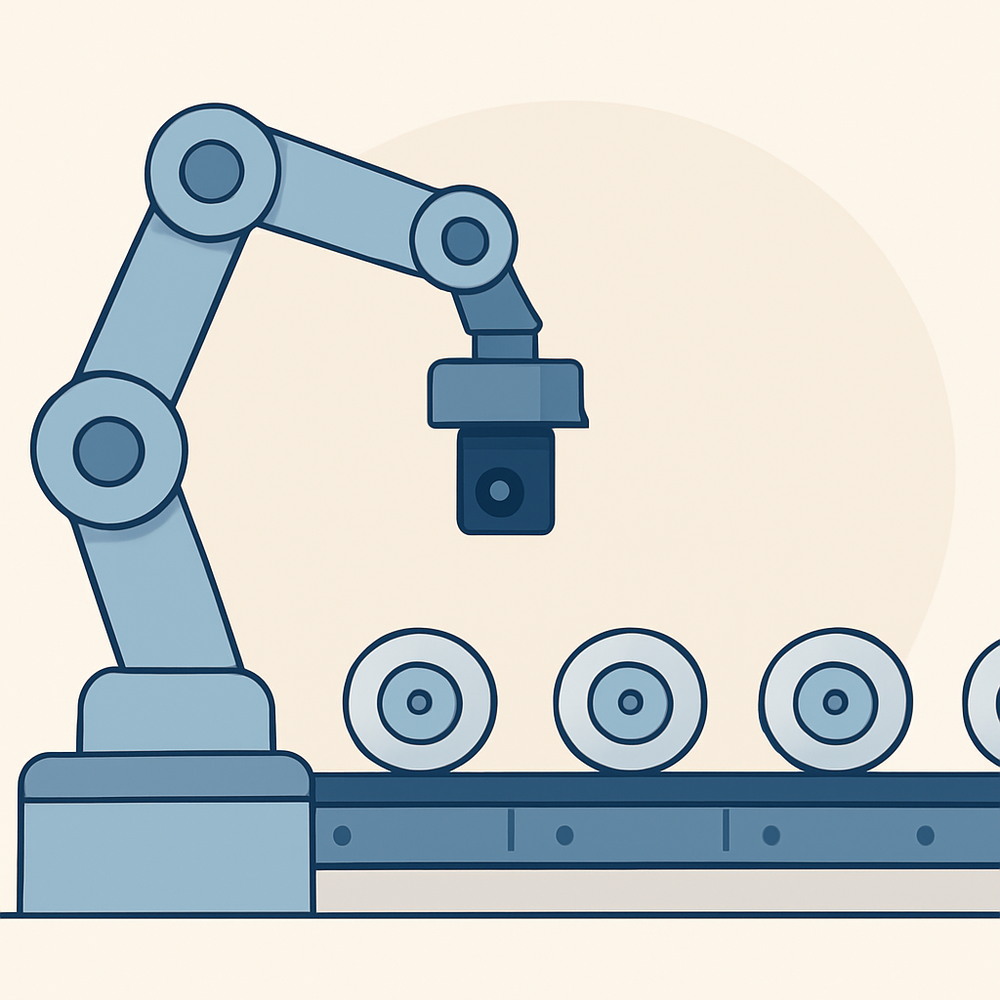
Automated visual inspection solves a different problem with a different constraint. Human inspectors are inconsistent across a shift in ways a camera isn't, and a vision system applies identical criteria at 3am and at shift change. computer vision in manufacturing covers the inspection, monitoring, and production-quality applications in more depth.
The scoping question that decides cost here is defect rarity. If the defect you're detecting occurs in one part per thousand, gathering enough positive examples to train reliably requires far more footage and far more annotation effort than a common defect does. This is the quality-control equivalent of the failure-data paradox: the better your process already is, the harder the model is to train, and the more the data collection phase dominates the budget.
Building a Business Case That Survives Review
Since industry-level ROI figures won't convince a plant controller, the case has to be built from your own numbers. Four inputs carry most of the weight.
Hourly downtime cost, calculated correctly
Use gross margin per production hour rather than revenue, and include idle labour, missed shipment penalties, and scrap generated during restarts. Most plants underestimate this figure by 30% to 40% on a first pass, which understates the entire business case.
Annual unplanned downtime hours
Pull twelve months from your CMMS. Without a CMMS, count emergency work orders and multiply average repair time by roughly 1.8 to account for secondary effects and restart time.
Asset criticality ranking
Rank by what a failure actually costs, not by asset value. Rotating equipment whose failure cascades into a full line stop consistently shows the highest returns, which is why focused pilots on five to ten high-downtime assets are the standard starting point.
A pilot designed to produce evidence
Run it on one bottleneck line, validate every alert against physical inspection, and document prevented failures with before-and-after cost data. building an AI PoC covers structuring this so it produces a defensible number rather than a demonstration.
The remaining barrier is people: 24% of plants cite skills gaps, since these projects need someone fluent in both plant operations and modelling. Most plants pair internal process knowledge with external technical capacity rather than hiring the full skill set, and dedicated ML hiring covers structuring that without paying for capacity you don't continuously need.
Frequently asked questions
What ROI does predictive maintenance actually deliver in manufacturing?
How much advance warning does AI predictive maintenance give?
Do we need historical failure data to start a predictive maintenance programme?
Should we monitor every machine or only some?
How is AI quality control different from predictive maintenance technically?
How do we calculate our plant's hourly downtime cost correctly?



Shreyans Padmani
Shreyans Padmani has 5+ years of experience leading innovative software solutions, specializing in AI, LLMs, RAG, and strategic application development. He transforms emerging technologies into scalable, high-performance systems, combining strong technical expertise with business-focused execution to deliver impactful digital solutions.