MIT's Project NANDA found that 95% of organizations investing in generative AI report zero measurable return on that spend. Deloitte's 2026 research puts a similar number on the other side of the equation: only 13% of organizations achieve measurable ROI on a typical AI use case within a year of deploying it.
The gap isn't usually that the AI doesn't work. It's that most organizations never build a way to actually measure whether it worked. AI ROI isn't hard to calculate because the math is complicated, the formula is simple. It's hard because most teams skip the two steps that make the formula mean anything: establishing a real baseline, and defining exactly what counts as value before the project starts, not after. Here's a framework that actually holds up when someone asks what the AI spend delivered.
Why Most Companies Can't Actually Prove AI ROI
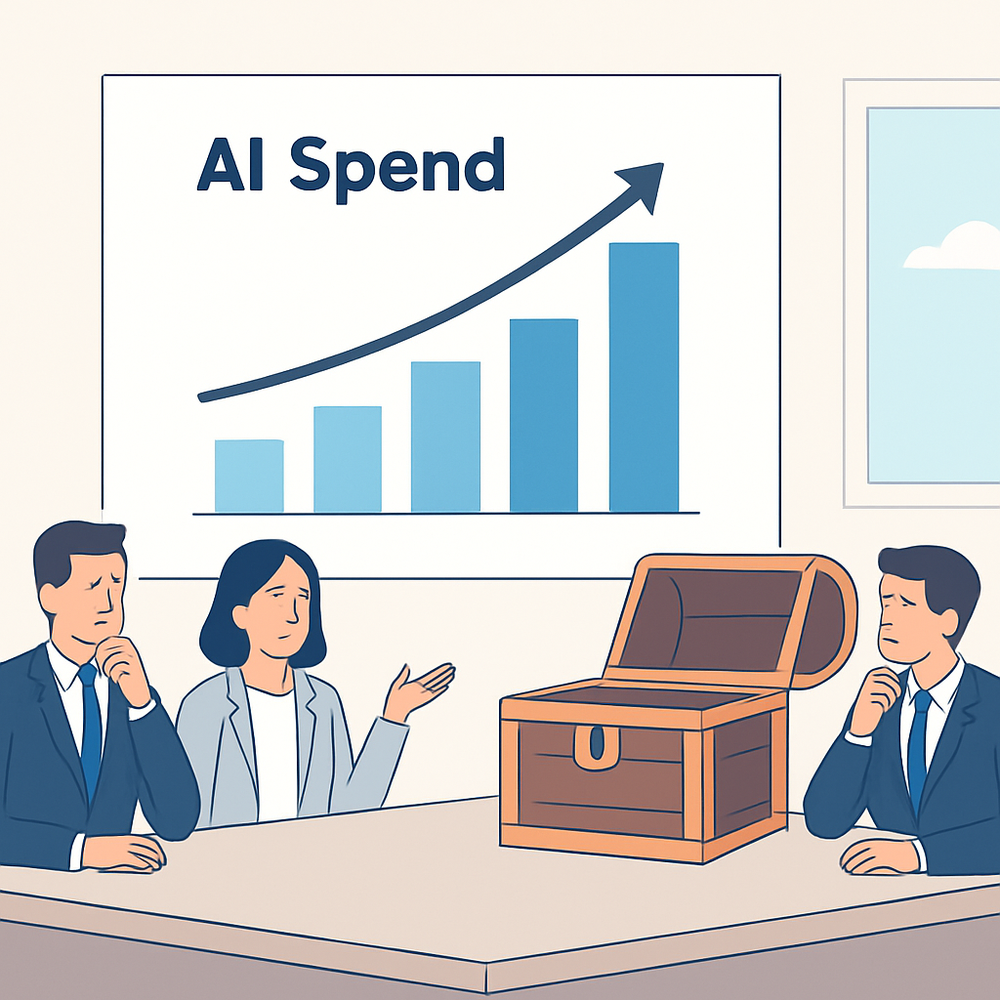
A separate 2026 survey found that only 29% of executives say they can measure AI's return with real confidence, and 56% of CEOs report seeing no net financial gain from AI investments at all. These aren't small, cautious deployments failing quietly, this is happening at scale, alongside enterprise AI budgets that are climbing sharply, with average enterprise AI spend projected to rise from roughly $7 billion in 2025 to $11.6 billion in 2026 industry-wide.
The pattern behind these numbers is consistent: most organizations track AI adoption, how many people use the tool, how many queries an agent handles, and mistake that for ROI. Adoption is not return. A chatbot that gets used constantly but never reduces headcount, deflects support volume, or protects revenue has high adoption and zero measurable ROI, and the two get confused constantly.
The Core Formula (and Why Both Sides Are Harder Than They Look)
The formula itself is not the hard part: ROI = (value created − total cost) ÷ total cost. Expressed as a percentage, this tells you how much return you got for every dollar spent. The difficulty is that both "value" and "cost" are far more multidimensional in an AI project than in most other business investments, and most ROI measurement failures trace back to one side or the other being defined too narrowly.
On the value side, teams often count only the most obvious benefit (usually hours saved) and miss revenue protected, errors prevented, or capacity freed for higher-value work. On the cost side, teams often count only the visible build cost and miss the ongoing operational spend that, as covered separately, often exceeds the initial development cost within the first year. Getting the formula right means being deliberately comprehensive on both sides before the first calculation is ever run.
Framework One: The Four Categories of AI Value
Rather than treating "value" as a single vague number, break it into four categories that can each be measured independently, then summed.
|
Category |
What it captures |
How to measure it |
|---|---|---|
|
Hours saved |
Time no longer spent on a task the AI now handles or accelerates |
(Hours per task before − hours per task after) × volume × fully loaded hourly cost |
|
Revenue protected or generated |
Deals saved, churn prevented, or net-new revenue directly attributable to the AI system |
Track conversion, retention, or attach rate for AI-touched cases vs. a control group |
|
Cost avoided |
Expenses that didn't happen because the AI caught something early or replaced a more expensive process |
Historical incident/error rate × average cost per incident, compared before and after |
|
Quality and error reduction |
Fewer mistakes, more consistent output, reduced rework |
Error or defect rate before vs. after, valued at the cost of catching and fixing each one |
Most AI systems generate value across two or three of these categories simultaneously, and measuring only one, usually hours saved because it's the easiest, is the single most common way real ROI gets understated or missed entirely.
Framework Two: Baseline, Then Measure
ROI measurement fails most often not because the math is wrong, but because there was never a real baseline to measure against. The practical fix is a fixed operating cadence: capture the honest before-state (current time-on-task, current error rate, current conversion rate) before the AI system goes live, then run a structured review at a fixed checkpoint, commonly six to eight weeks after launch, rather than waiting for an annual review or measuring informally whenever someone asks.
This is exactly the discipline a well-run building an AI PoC phase is supposed to establish before any full-scale investment happens: a PoC without a defined success metric and a real baseline to compare against isn't actually testing anything, it's just running a demo with extra steps. The same baseline-then-measure discipline that makes a PoC meaningful is what makes a production ROI number defensible six months later.
Hire AI ROI Specialist
Boost measurable AI returns with our experts – Get Free POC Scoping
Get Free POC ScopingWhat "Total Cost" Actually Means in the Denominator
The denominator in the ROI formula needs to be the fully loaded cost, not just the invoice for development work. That includes the initial build, ongoing API or compute spend, integration maintenance, and the human time spent managing and reviewing the system, all of which continue well past launch day. AI development pricing guide breaks down what typically goes into the initial build side of that number across different project types.
Where the team sits also changes this number meaningfully without changing the value side of the equation at all. AI developer cost by region shows how much regional cost differences alone can shift the total cost of ownership, which directly moves the ROI percentage even when the delivered value stays identical.
A Worked Example From Start to Finish
Consider a support ticket triage system built to automatically categorise and route incoming tickets. Before launch, the baseline shows support staff spending an average of 4 minutes per ticket on manual categorisation, across 10,000 tickets a month, at a fully loaded staff cost of $28 per hour.
That's roughly 667 hours a month of manual triage time, worth about $18,700 monthly before the AI system existed. After launch, the system handles categorisation automatically for 80% of tickets, cutting manual triage time to roughly 133 hours a month, worth about $3,720. The hours-saved value alone is $14,980 a month, or roughly $179,760 annualised.
Against that, total cost includes a $35,000 initial build, $600 a month in ongoing API spend, and roughly $2,000 a month in a part-time reviewer's time checking flagged edge cases, for a first-year total cost of $66,200. Using the formula: ROI = ($179,760 − $66,200) ÷ $66,200 = 172% in year one. That's a real, defensible number, because every input traces back to a measured baseline and a specific, itemised cost, not an estimate pulled from a vendor's pitch deck.
Common Mistakes That Quietly Break AI ROI Measurement
Measuring adoption instead of outcomes
Usage metrics (logins, queries handled, messages sent) describe engagement, not value. A system can have perfect adoption and negative ROI if it isn't actually reducing cost, protecting revenue, or improving quality against a real baseline.
Skipping the baseline entirely
Without a documented before-state, any after-launch number is an opinion, not a measurement. Teams that skip this step almost always end up either overclaiming (because memory of "how bad it used to be" inflates over time) or unable to defend the number at all when a CFO asks for the comparison.
Undercounting the cost side
Counting only the initial build and ignoring ongoing API spend, maintenance, and review time systematically inflates the ROI percentage, sometimes dramatically, since production operational costs commonly run several times higher than pilot-stage estimates once real usage volume shows up.
Frequently asked questions
What is the formula for measuring AI ROI?
Why do most companies struggle to measure AI ROI?
How long does it take to see measurable AI ROI?
What should be included in the cost side of an AI ROI calculation?
What's the difference between AI adoption and AI ROI?
How do I build a business case for AI ROI before a project even starts?



Shreyans Padmani
Shreyans Padmani has 5+ years of experience leading innovative software solutions, specializing in AI, LLMs, RAG, and strategic application development. He transforms emerging technologies into scalable, high-performance systems, combining strong technical expertise with business-focused execution to deliver impactful digital solutions.